Feature engineering duty cycles
Industrial time series are hard. Not knowing the system is even harder.
Before modeling, I want to have an understanding of the data. Knowing how your data is generated, leads to better modeling decisions.
Let me talk you through feature engineering duty cycles; or how to understand the system you are modeling based on data.
Diving into the data
Generally we know the system that we are modeling, but what if we don’t?
Figure Figure 1 shows an impression of how the torque of a clutch may vary over over time. Besides this, we have no information about the system.
Can we learn something about the system, purely based on the data?
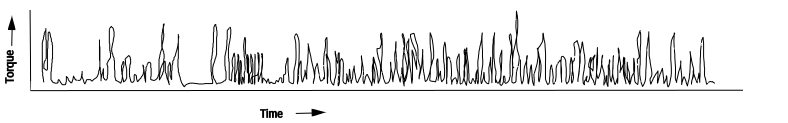
The clutch torque is rapidly oscillating between 0 and a maximum, and we can make some more observations:
- Spikes are irregular
- Spikes frequency increases over time
- Spikes occur in bursts
- Bursts are not periodic
- “Burst packages” follow a pattern that looks like a wave
- There is a “near zero” period
Basically there are 2 points:
- The system is changing over time, in the sense that it is non-stationary.
We can capture that with some features:
- Sliding windows of variance, max, min, mean
- Zero crossing rates; how many times signal crosses mean in a given time window
- Engagement / disengagement matters for clutches.
We can capture that with features like:
- Max of the peak
- Min of low
- Difference between max and min
- Time to peak
- Peak width
- Area under peak
- Time since last peak
- Time since last mean crossing
- Indicator engaging / disengaging
- Time since last low
- Rate of change (1th, 2th order difference)
Time to peak means how long it reach a peak from the last minimum
For those features we need to do peak identification first.
From the engagement / disengagement features we can derive moving statistics to capture changes; e.g. running average of time to peak, running average of peak height, running average of peak width.
Wrapping up
The process was
- Make some observations
- Determine what is of interest in the data & systems; in this case
- Distribution changes over time (non-stationary)
- Engagements / disengagements
- Engineer features that expose those characteristics further