5 Tools to monitor GPU training
Introduction
Training models takes experimentation, iteration — and watching your system like a hawk. If you’re not monitoring your GPUs and I/O closely, you’re probably wasting time (and compute).
There are always opportunities to improve model performance — but only if you catch them early in training. I run experiments across 5 GPUs on my local rig, constantly tweaking architectures and training setups. These tools help me spot bottlenecks before they waste hours.
5 system monitoring tools
Here are the 5 tools I use to monitor the system performance while training models.
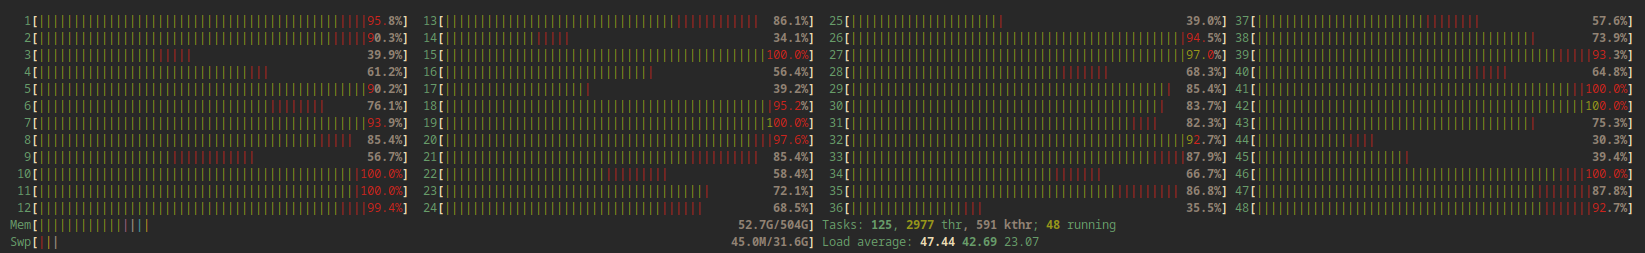
Htop
A classic terminal tool that shows CPU usage per core, memory usage, and swap. I use htop first when optimizing data loading and CPU-bound preprocessing. Pro tip: Filter by command or user with F4 to isolate your training jobs.
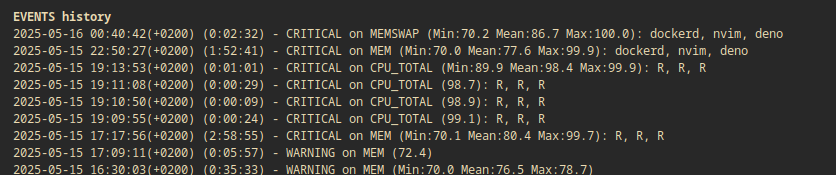
Glances
When the bottleneck isn’t the CPU, it’s usually I/O. glances shows disk, network, memory, and even Docker stats — all in one dashboard.
Pro tip: Look at the event log (bottom) for hidden issues like memory overflows or OOM kills.
Nvidia-smi
The go-to tool for checking real-time GPU usage, memory, and temperature. nvidia-smi is great for a quick status check. Pro tip: Run `watch -n 0.5 n
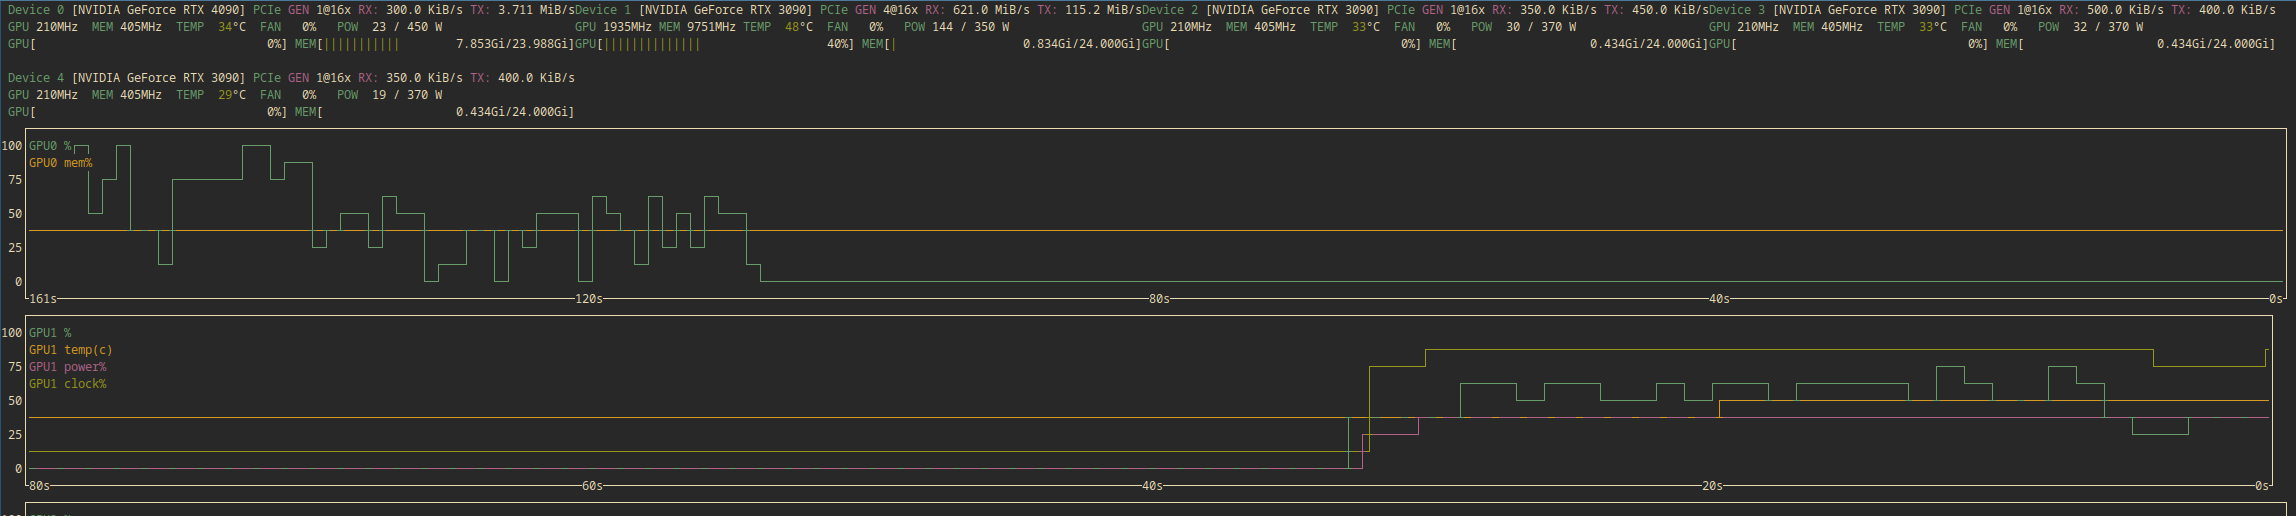
Nvtop
Nvtop show life updating graphs of GPU usage over time. It reveals more about the usage patterns of training process compared to nvidia-smi, which displays instant usage.
In addition nvtop shows the names and user names of all processes that use a GPU.
More tools for system monitoring
Do use tensorboard or ml-flow
Once tried logging system metrics like GPU and memory usage to TensorBoard and MLflow. I figured: “Why not store the full picture?” Turns out — that was a bad idea.
These dashboards are great for tracking training metrics, but terrible for system monitoring. The UI is clunky, not optimized for quick glances, and it’s a hassle to configure system stats. Add to that a 10+ second lag, heavy log files, and noticeable overhead — and it’s just not worth it.
Tmux for session management
Training multiple models at once feels like playing simultaneous chess. A terminal multiplexer like tmux helps you switch between REPLs, diagnostics, and training jobs without losing your flow. Even better: it keeps everything running when you disconnect — perfect for long training runs on remote machines.
Pro tip: Use tmuxp to save and restore full tmux sessions.
Conclusion
Great training runs come from great setups. These tools help you catch bugs faster, track resource bottlenecks, and avoid silent failures.
Monitoring tools won’t make your model smarter — but they will make you smarter. If you train on your own hardware (or even on Colab/Kaggle), give these tools a try.
What’s your go-to tool for training-time debugging? Did I miss a favorite?